Wednesday February 29, 2012 – Periods 1 & 3
Thursday March 1, 2012 – Periods 4 & 6
Today we learned that the degree in which a demand or supply curve reacts to a change in price is elasticity. Elasticity varies among products because some products that are necessities are more insensitive to price changes because consumers would continue buying these products despite price increases. A price increase of a good or service that is considered less of a necessity will deter more consumers because buying the product will be too high a cost.
A good or service is considered to be elastic if a slight change in price leads to a large change in the quantity demanded or supplied. Usually these kinds of products are readily available in the market and consumers may not necessarily need them in their daily life. An inelastic good or service is one in which changes in price experience only modest changes in the quantity demanded or supplied. These goods tend to be things that are more of a necessity to the consumer in their daily life.
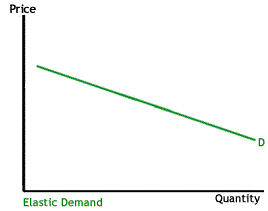 If there is a large decrease in the quantity demanded with a small increase in price, the demand curve looks flatter, or more horizontal. This flatter curve means that the good or service in question is elastic.
 Inelastic demand is represented with a much more upright curve as quantity changes little with a large movement in price.
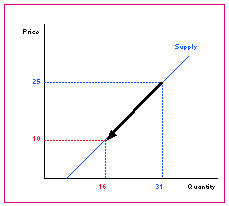
 Elasticity of supply works similarly. If a change in price results in a big change in the amount supplied, the supply curve appears flatter and is considered elastic.
 If a change in price only results in a minor change in the quantity supplied, the supply curve is steeper and is inelastic.
There are three main factors that influence a demand’s price elasticity. The first factor is the availability of substitutes. This is probably the most important factor influencing the elasticity of a good or service. The more substitutes, the more elastic the demand will be.
The second influential factor is the amount of income available to spend on the good – This factor affecting demand elasticity refers to the total a person can spend on a particular good or service. If there is an increase in price and no change in the amount of income to spend on the good, there will be an elastic reaction in demand.
The third influential factor is time. If the price of a good or service goes up and there are very few available substitutes, consumers will most likely continue buying the product. This means that the good or service is inelastic because the change in price will not have a significant influence on the quantity demanded. If consumers find that they cannot afford to spend the extra cost and begin to buy less of the product over a period of time, the price elasticity of the good or service for that consumer becomes elastic in the long run.
There are four main factors that affect the elasticity of supply. The first factor is spare production capacity If there is plenty of spare capacity then a business should be able to increase its output without a rise in costs. Therefore supply will be elastic in response to a change in demand. The supply of goods and services is often most elastic in a recession, when there is plenty of spare labor and capital resources available to step up output as the economy recovers.
The second factor is stocks of finished products and components If stocks of raw materials and finished products are at a high level then a firm is able to respond to a change in demand quickly by supplying these stocks onto the market and supply will be elastic. Conversely when stocks are low, dwindling supplies force prices higher and unless stocks can be replenished, supply will be inelastic in response to a change in demand.
The third factor is the ease and cost of factor substitution If both capital and labor resources are mobile then the elasticity of supply for a product is higher than if capital and labor cannot easily and quickly be switched
Finally, the fourth factor is the time period involved in the production process. Supply is more elastic the longer the time period that a firm is allowed to adjust its production levels.

Filed under: class, demand, demand curve, economics, elastic, elastic demand, elastic supply, elasticity, inelastic, inelastic demand, inelastic supply, supply, supply curve | Comments Off on Elasticity of Demand and Supply
 Chapter test on supply, demand, and equilibrium.


